A Study on Classification and Segmentation of Brain Tumor MRI using MediAI
A Study on Classification and Segmentation of Brain Tumor MRI using MediAI
http://dx.doi.org/10.4283/JMAG.2025.30.1.74
Abstract
Brain tumors, arising due to genetic, environmental, and immune system factors, are typically classified as
primary or metastatic. Primary brain tumors originate from brain tissue and include types such as adenomas,
epithelial tumors, gliomas, meningiomas, and schwannomas, while metastatic tumors spread from other body
parts. The rapid and accurate diagnosis of brain tumors is crucial, and MRI is an indispensable tool in this
regard due to its non-invasive nature and superior imaging capabilities. This study focuses on developing a
method for the classification and segmentation of MRI images of primary brain tumors, particularly gliomas,
to enhance diagnosis and treatment assessment. We propose MediAI, a Convolutional Neural Network (CNN)
leveraging transfer learning with ResNet50, to classify MRI images of brain tumors. The dataset comprises 414
MRI images of primary brain tumors (86 adenomas, 84 epithelial tumors, 82 gliomas, 80 meningiomas, and 82
schwannomas) and 39 normal MR images, sourced from various public datasets. Experimental results
demonstrated that MediAI achieved an impressive classification accuracy of 97.6 %. For tumor segmentation,
we applied anisotropic diffusion filtering, followed by thresholding using the Otsu method, to accurately detect
and delineate tumor regions, particularly in glioblastomas, highly malignant brain tumors. Tumor regions
were further refined through morphological operations, and the final tumor contours were extracted and
overlaid on the original images. Performance evaluation of MediAI was conducted using a confusion matrix,
calculating precision, recall, and F1-score for each tumor type. Results indicated that gliomas, in particular,
were classified with a precision of 91 %,a recall of 99 %, and an F1-score of 95 %. A comparison with existing
studies demonstrated that MediAI outperforms previous methods, achieving the highest reported accuracy for
brain tumor classification at 97.6 %. The proposed methodology not only facilitates accurate brain tumor
classification but also enhances the monitoring of treatment responses by tracking changes in segmented tumor
regions. Future work will focus on utilizing Radiomics to map tumor, necrotic, and edema regions for
advancing diagnostic and therapeutic paradigms in glioma treatment.
1. Introduction
Brain tumors develop due to genetic predispositions,
environmental factors, and immune system abnormalities.
Specific genetic mutations can disrupt the regulation of
cellular growth, potentially leading to tumor formation.
Additionally, abnormalities in intracellular signaling
pathways can influence cellular proliferation and survival,
contributing to tumorigenesis [1]. Chronic inflammation
plays a critical role in tumor development by promoting
cell growth and survival. Certain hormones also affect
cellular growth, with some brain tumors linked to
hormonal changes. Brain tumors are classified into
primary and metastatic types [2]. Primary brain tumors
originate from specific types of brain cells or tissues
within the brain, including adenomas, epithelial tumors,
glioblastomas, meningiomas, and schwannomas. In
contrast, metastatic brain tumors result from the spread of
cancer cells from other body parts, such as lung, breast, or
skin cancer, which disseminate to the brain via the
bloodstream. Metastatic tumors can spread from their
original site, leading to cancer manifestation in multiple
locations [3]. The diagnosis of brain tumors typically
involves neurological exams, biopsies for histological
analysis, blood tests to measure specific tumor markers,
and imaging techniques like MRI, CT, and PET scans.
Among these modalities, MRI has proven to be an
indispensable tool for the rapid and accurate diagnosis of
brain tumors due to its non-invasive nature and versatile
imaging capabilities [4]. Glioblastoma, a form of glioma,
originates from astrocytes in the brain and is characterized by high malignancy, making it the most common
primary intracranial tumor in the central nervous system
[5]. While glioblastomas are most frequently located in
the cerebral hemispheres, they can also occur in other
brain or spinal cord regions. The prognosis for glioblastoma is poor, with survival rates averaging around
five years [6]. On MRI, glioblastomas appear as regions
of high signal intensity with surrounding edema on T2-weighted and FLAIR images, while they show low signal
intensity on T1-weighted images. Contrast-enhanced
imaging reveals significant enhancement due to the
disruption of the blood-brain barrier (BBB) [7]. As highly
aggressive tumors with a poor prognosis, glioblastomas
rely heavily on MRI for diagnosis and assessment.
Diffusion-weighted imaging (DWI) is especially valuable
for evaluating glioblastomas, as it is sensitive to changes
in the movement of water molecules within the tissue. On
DWI, the high cellular density of glioblastomas restricts
diffusion, resulting in increased signal intensity. Apparent
diffusion coefficient (ADC) maps, derived from DWI,
quantify diffusion. Due to their high cellular density,
glioblastomas typically exhibit low ADC values [8].
However, necrotic regions within the tumor may contain
fluid, which can lead to elevated ADC values in these
areas. DWI can also reflect changes in cellular density
during treatment: decreased cellular density increases
diffusion, leading to higher ADC values, while increased
cellular density restricts diffusion, resulting in lower ADC
values. These ADC values can serve as biomarkers for
evaluating treatment response in glioblastomas, with
newly restricted diffusion indicating tumor progression or
recurrence [9]
2. Materials and Methods
2.1. Brain Tumor MRI Dataset
The data set for the study consisted of 414 primary
brain tumor MR images of 86 adenomas, 84 epithelial
tumors, 82 glioblastomas, 80 meningiomas, 82
schwannomas, and 39 normal MR images, for a total of
453 images. The images were collected from GitHub and
NEJM [10], Auntminnie [11], Medscape [12], Radiology
cases [13], and radiopaedia [14] sites, labeled by brain
tumor, and organized into a file named ‘BrainTumors_1.1.zip’.
 |
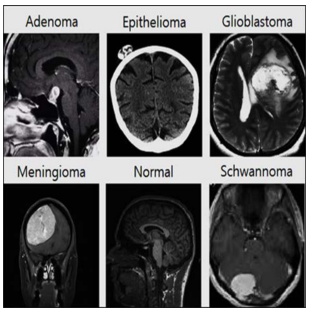
| Fig. 1. Part of the MR images of brain tumors for the experiment (Adenoma, Epithelioma, Glioblastoma, Meningioma, Schwannoma). |
Fig. 1 shows a portion of the MR images of Adenoma, Epithelioma, Glioblastoma, Meningioma, and Schwannoma brain tumors constructed for the experiment.
2.2. Brain Tumor Classification using CNN
The Convolutional Neural Network (CNN) developed
for brain tumor classification, referred to as MediAI, was
constructed using a transfer learning approach based on
ResNet50.
 |
| Fig. 2. (Color online) Structure of MediAI that classifies brain tumors using ResNet transfer learning |
Similar to most CNN architectures, MediAI aims to improve recognition accuracy and reduce training time by utilizing feature values extracted from input images as training data. This is achieved through a repetitive process of convolution and pooling, where feature extraction and down-sampling occur iteratively. During this iterative process, the characteristics of the input images are progressively refined and abstracted with each successive layer [15]. In MediAI, the flattening stage transforms the feature maps generated by the convolutional and pooling layers into a one-dimensional vector. By concatenating multiple independent one-dimensional vectors within a dense layer—specifically, a fully connected layer—a multilayer perceptron (MLP) is formed [16]. The MLP classifies the images through the application of activation functions. For hyperparameter optimization in MediAI, Bayesian Optimization was employed. This method selects the next hyperparameter combination based on previous results. A model was trained for each combination of hyperparameters, and performance was evaluated using a validation dataset. Precision, recall, and F1-score were used as the performance metrics [17]. Fig. 2 illustrates the structure of MediAI, which classifies brain tumors using ResNet-based transfer learning.
2.3. Tumor Region Segmentation
Following the classification of brain tumors in MRI
scans, tumor region detection and segmentation are
carried out on selected specific brain tumor MRIs
according to the steps outlined in Table 1.

3. Experiment and Result
The experiments for segmenting tumor regions in
glioblastomas from brain MRI were conducted following
the procedure illustrated in Fig. 3.
 |
| Fig. 3. (Color online) Experimental procedures for brain tumor classification and glioblastoma segmentation |
 |
| Fig. 4. Brain tumor images classified by MediAI training |
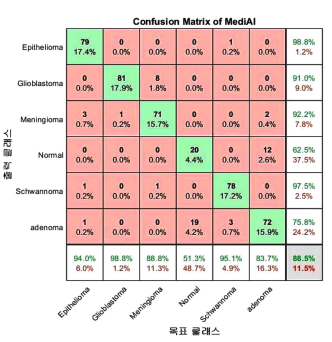 |
| Fig. 5. (Color online) MediAI's confusion matrix for classification of brain tumor MR images. |
 |
| Fig. 6. (Color online) MediAI's ROC Curve for Classifying Brain Tumor MR Images. |
As illustrated in Fig. 6, the
accuracy was found to be 97 %.
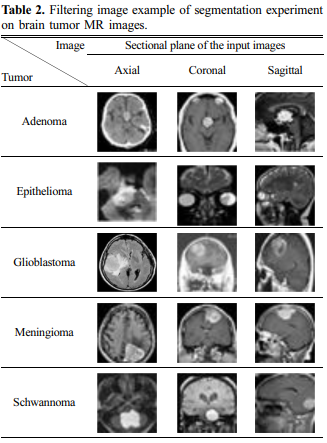
To facilitate the segmentation of tumor regions in brain tumors classified by MediAI, preprocessing was performed
through filtering to reduce noise, and the images were
resized to 256 × 256 pixels. The filtered images are
shown in Table 2.
Among the filtered images, those predicted to be glioblastoma were selected, as shown in Fig. 7.
 |
| Fig. 7. Images classified as glioblastoma in MediAI's brain tumor MRI classification experiment. |
The selected image underwent a thresholding
process to binarize the image and separate the tumor
regions from the background. During this process, the
threshold was automatically adjusted to accurately detect
the tumor regions. Based on the identified tumor regions,
the tumor segmentation stage involved marking the tumor
area with a red bounding box.
 |
| Fig. 8. (Color online) Bounding box image in a brain glioblastoma segmentation experiment. |
Fig. 8 presents an image with a bounding box in a glioblastoma segmentation experiment. Subsequently, the extracted tumor contours are presented in Fig. 9.
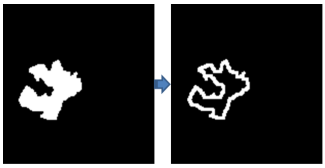 |
| Fig. 9. (Color online) Tumor outline obtained by performing erosion. |
Finally, the tumor contours were overlaid onto
the original images. Fig. 10 shows the images with the
tumor contours overlaid.
 |
| Fig. 10. (Color online) Detection of glioblastoma. |
4. Discussion
This study proposes a method for classifying MRI
scans of primary brain tumors, including adenomas,
epithelial tumors, gliomas, meningiomas, and schwannomas,
by disease type, with a particular focus on segmenting the
tumor regions of gliomas.
To improve the data dependency problem and interpretability of MediAI and to verify whether the
generalized prediction for various data sets is reliable, we
conducted an experiment using data augmentation
techniques as shown in Fig. 11.
 |
| Fig. 11. (Color online) Image processing-based data augmentation. |
The results of the experiment showed that the difference between the original data set and the augmented data set was as shown in Fig. 12.
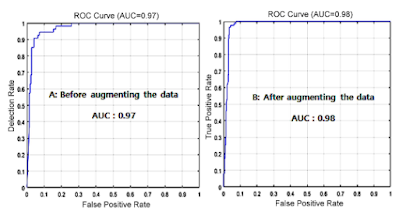 |
| Fig. 12. (Color online) Experimental results (AUC) before and after data augmentation. |
The reason why the difference before and after data augmentation is not large is thought to be because MediAI, a transfer learning technique, uses dropout to solve the data overfitting problem. Dropout is a method of proceeding with learning while omitting some neurons in the fully connected layer. It changes the values of some neurons to 0 so that they have no effect on the forward pass and backpropagation. Dropout is applied during training, and all neurons are used during testing. ResNet50 outperforms previous AlexNet in medical imaging research due to its deep residual learning function, high accuracy, efficiency, scalability, and overfitting problem-solving by skin connection.
 |
| Fig. 13. (Color online) Performance evaluation results of ResNet50 and AlrexNet after data augmentation. |
The experimental results to compare the performance of Resnet50 and AlrexNet are shown in Fig. 13. Brain tumor classification in the proposed MR images was performed using MediAI, achieving an accuracy of 97.6 %. Additionally, the precision, recall, and F1-score for the classified Brain Tumor types, calculated using a confusion matrix, are presented in Fig. 14.
 |
| Fig. 14. (Color online) Precision, recall, and F1-score for Brain Tumor types calculated using a confusion matrix. |
To validate the effectiveness of this study, previous
research analyzing disease classification in MRI scans
was reviewed. In the study "Convolutional Neural Networks for MultiClass Brain Disease Detection Using MRI Images" by
Muhammed Talo et al., pre-trained models such as
AlexNet, VGG-16, ResNet-18, ResNet-34, and ResNet50 were used to automatically classify MRI scans into
categories of normal, cerebrovascular diseases, neoplasms,
degenerative, and inflammatory diseases. Among these
five pre-trained models, ResNet-50 achieved the highest
classification accuracy of 95.23 % ± 0.6 % [19].
In the research titled "Brain Tumor Detection in Brain
MRI Using Deep Learning" by Abhishek Anil et al.,
AlexNet achieved an accuracy of 89.64 %, VGG16
reached 93.22 %, and VGG19 achieved 95.78 % accuracy
[20].
Driss Lamrani et al. reported in their study "Brain
Tumor Detection Using MRI Images and Convolutional
Neural Networks" that pre-trained architecture models
achieved 96 % precision and classification accuracy [21].
Soheila Saeedi et al. proposed a 2D CNN in "MRIBased Brain Tumor Detection Using Convolutional Deep
Learning Methods and Selected Machine Learning
Techniques," achieving an accuracy of 96.47 %, with the
learning accuracy of the proposed autoencoder network
being 95.63 %.
P. Gokila Brindha et al. mentioned that the CNN model
applied to the test data in their study "Brain Tumor
Detection in MRI Images Using Deep Learning
Techniques" achieved an accuracy of 89 % [22, 23].
Finally, Javeria Amin et al. reported an average
accuracy of 97.1 % in their research "A Unique Approach
to Brain Tumor Detection and Classification Using MRI,"
as shown in Fig. 15.
 |
| Fig. 15. (Color online) Comparison of accuracy of MediAI and other experiments in disease classification in brain tumor MRI |
As seen in this study, the implemented MediAI achieved the highest accuracy of 97.6 % [24]. Glioblastoma is a highly aggressive brain tumor with a poor prognosis, and MRI plays a crucial role in its diagnosis and evaluation. Within MRI, DWI is particularly useful for assessing glioblastomas, as it is sensitive to changes in the movement of water molecules within the tissue. This study focuses on classifying brain tumors in MRI and, in particular, on detecting and segmenting the tumor regions in highly aggressive glioblastoma MRI DWI scans. Anisotropic diffusion filtering was initially applied to the selected glioblastoma MRI DWI scans to continuously filter the images and reduce contrast between pixels. The images were then resized, and thresholding techniques were used to convert the images into binary form. This filtering process aimed to separate potential tumor locations. Subsequently, morphological operations were applied to the pre-processed images to extract robust information from the potential tumor regions. Through this methodology, tumor regions were delineated based on the statistical average of glioblastoma involvement in MRI DWI. While this approach provided accurate results in most cases, difficulties arose when the tumor size was too small or when the tumor exhibited heterogeneous distribution patterns.
5. Conclusion
This study presents a refined approach to classifying
MRI scans related to primary brain tumors, including
adenomas, epithelial tumors, gliomas, meningiomas, and
schwannomas, with a particular emphasis on the
segmentation of glioma tumor regions.
To achieve this classification, MediAI was meticulously
developed using a transfer learning methodology based
on a convolutional neural network, ResNet50.
The dataset used for this study was constructed from
414 primary brain tumor MRI images, including 86
adenomas, 84 epithelial tumors, 82 gliomas, 80 meningiomas, and 82 schwannomas, as well as 39 normal MR
images. These images were sourced from GitHub, NEJM,
AuntMinnie, Medscape, Radiology Cases, and Radiopaedia, and compiled into the file "BrainTumors_1.1.zip."
Experimental results showed that brain tumor MR
images were classified with an accuracy of 97.6 %.
To rigorously evaluate MediAI’s performance, a confusion
matrix was employed to calculate precision, recall, and
F1-score for each tumor category.
• The results revealed that adenomas achieved a
precision of 76.0 %, a recall of 84.0 %, and an F1-score
of 80 %.
• Epithelial tumors exhibited a precision of 99.0 %,
recall of 94.0 %, and an F1-Score of 96 %.
• Gliomas achieved a precision of 91.0 %, recall of 99.0
%, and an F1-Score of 95 %.
• Meningiomas showed a precision of 92.0 %, recall of
89.0 %, and an F1-Score of 90 %.
• In contrast, schwannomas achieved a precision of 98.0
%, recall of 95.0 %, and an F1-Score of 96 %.
A comparative analysis with existing literature underscores the superior accuracy of this study, with MediAI
achieving a 97.6 % accuracy.
Within the spectrum of brain tumors, gliomas are
known for their aggressive nature and poor prognosis.
This study performed a series of experiments specifically
aimed at detecting and segmenting tumor regions within
glioma images. The results confirm the accurate detection
and segmentation of brain tumors, facilitating the differentiation of tumor regions within the identified areas. This
capability not only enhances the accuracy of glioma
diagnosis, the deadliest form of brain tumor, but also
enables monitoring the changes in segmented tumor
regions throughout the treatment process, thereby aiding
in the evaluation of therapeutic efficacy.
Future research will focus on advancing diagnostic and
assessment paradigms for glioma treatment efficacy by
mapping the identified tumor, necrotic, and edema
regions using Radiomics methodologies.
References
[1] R. N. Curry and S. M. Glasgow, Front Cell Dev. Biol. 9,
659055 (2021).
[2] S. Hibino, T. Kawazoe, H. Kasahara, S. Itoh, T. Ishimoto,
M. S. Yanagimoto, and K. Taniguchi, Int. J. Mol. Sci. 22,
5421 (2021).
[3] J. Ricardo, M. Figueroa, and E. Q. Lee, Am J. Med. 131,
874 (2018).
[4] W. B. Overcast, K. M. Davis, C. Y. Ho, G. D. Hutchins,
M. A. Green, B. D. Graner, and M. C. Veronesi, Curr.
Oncol. Rep. 23, 34 (2021).
[5] A. A. Abd-Elghany, A. A. Naji, B. A, H. Aldosary, M. A.
Alsufayan, M. Alnasser, A. M. Ebtsam, and M. Z. Mahmoud, J. Radiat. Res. Appl. Sci. 12, 289 (2019).
[6] A. K. Altwairgi, W. Algareeb, G. Yahya, and A. M. Maklad, Mol. Clin. Oncol. 4, 756 (2016).
[7] K. Y. Shim, S. W. Chung, J. H. Jeong, I. Hwang, C. K.
Park, T. M. Kim, S. H. Park, J. K. Won, J. H. Lee, S. T.
Lee, R. E. Yoo, K. M. Kang, T. J. Yun, J. H. Kim, C. H.
Sohn, K. S. Choi, and S. H. Choi, Sci. Rep. 11, 9974
(2021).
[8] H. Lee, H. O. Kim, and Y. M. Huh, J. Magn. 25, 567
(2020).
[9] A. Afaq, A. Andreou, and D. M. Koh, Cancer Imaging.
10, 179 (2010).
[10]https://github.com/SartajBhuvaji/Brain-Tumor-Classification-DataSet/tree/master/Testing
[11] https://my.auntminnie.com/cases/
[12] https://search.medscape.com/search?q=Brain%20Tumor
%20MRI&plr=ref
[13] https://mrionline.com/case-of-the-week
[14] https://radiopaedia.org/search?q=Brain+MRI&scope=all
&lang=us
[15] R. Yamashita, M. Nishio, Do, R. K. G. Do, and K.
Togashi, Insights into Imaging 9, 611 (2018).
[16] X. Zhao, L. Wang, Y. Zhang, X. Han, M. Deveci, and M.
Parmar, Artif. Intell. Rev. 57, 10462 (2024).
[17] J. Snoek, H. Larochelle, and R. P. Adams, Advances in
Neural Information Processing Systems. 25, 2951 (2012).
[18] N. Otsu, IEEE Transactions on Systems, Man, and
Cybernetics. 9, 62 (1979).
[19] M. Talo, O. Yildirim, U. B. Baloglu, G. Aydin, and U. R.
Acharya, Comput. Med. Imaging Graph. 78, 312 (2019).
[20] A. Anil, A. Raj, H. A. Sarma, and N. C. R. Deepa, International Journal of Innovative Research in Applied Sciences and Engineering. 3, 15 (2019).
[21] D. Lamrani, B. Cherradi, O. El Gannour, M. A. Bouqentar, and L. Bahatti, Int. J. Adv. Comput. Sci. Appl. 13,
452 (2022).
[22] S. Saeedi, S. Rezayi, H. Keshavarz, and S. R. N. Kalhori,
BMC Med. Inform. Decis. Mak. 23, 2144 (2023).
[23] P. G. Brindha, M. Kavinraj, P. Manivasakam, and P. Prasanth, IOP Conf. Ser.: Mater. Sci. Eng. 1055 (2021).
[24] J. Amin, M. Sharif, M. Yasmin, and S. L. Fernandes, Pattern Recognit. Lett. 139, 118 (2020).
by Ph. D., M. D. Hwunjae Lee


Comments
Post a Comment